Introduction
When building a website, landing page, SaaS application, or eCommerce platform, teams often debate questions such as:
- Should the CTA button be green or blue?
- Does a shorter signup form increase conversions?
- Will a different headline generate more leads?
- Should pricing be displayed monthly or annually?
The problem is that opinions rarely reflect actual user behavior.
This is where A/B testing becomes valuable.
A/B testing allows businesses to make decisions based on real user data rather than assumptions. Instead of guessing which design or content performs better, you can measure the impact of each variation and confidently choose the version that drives better results.
In this guide, we'll explore in depth.
What is A/B Testing?
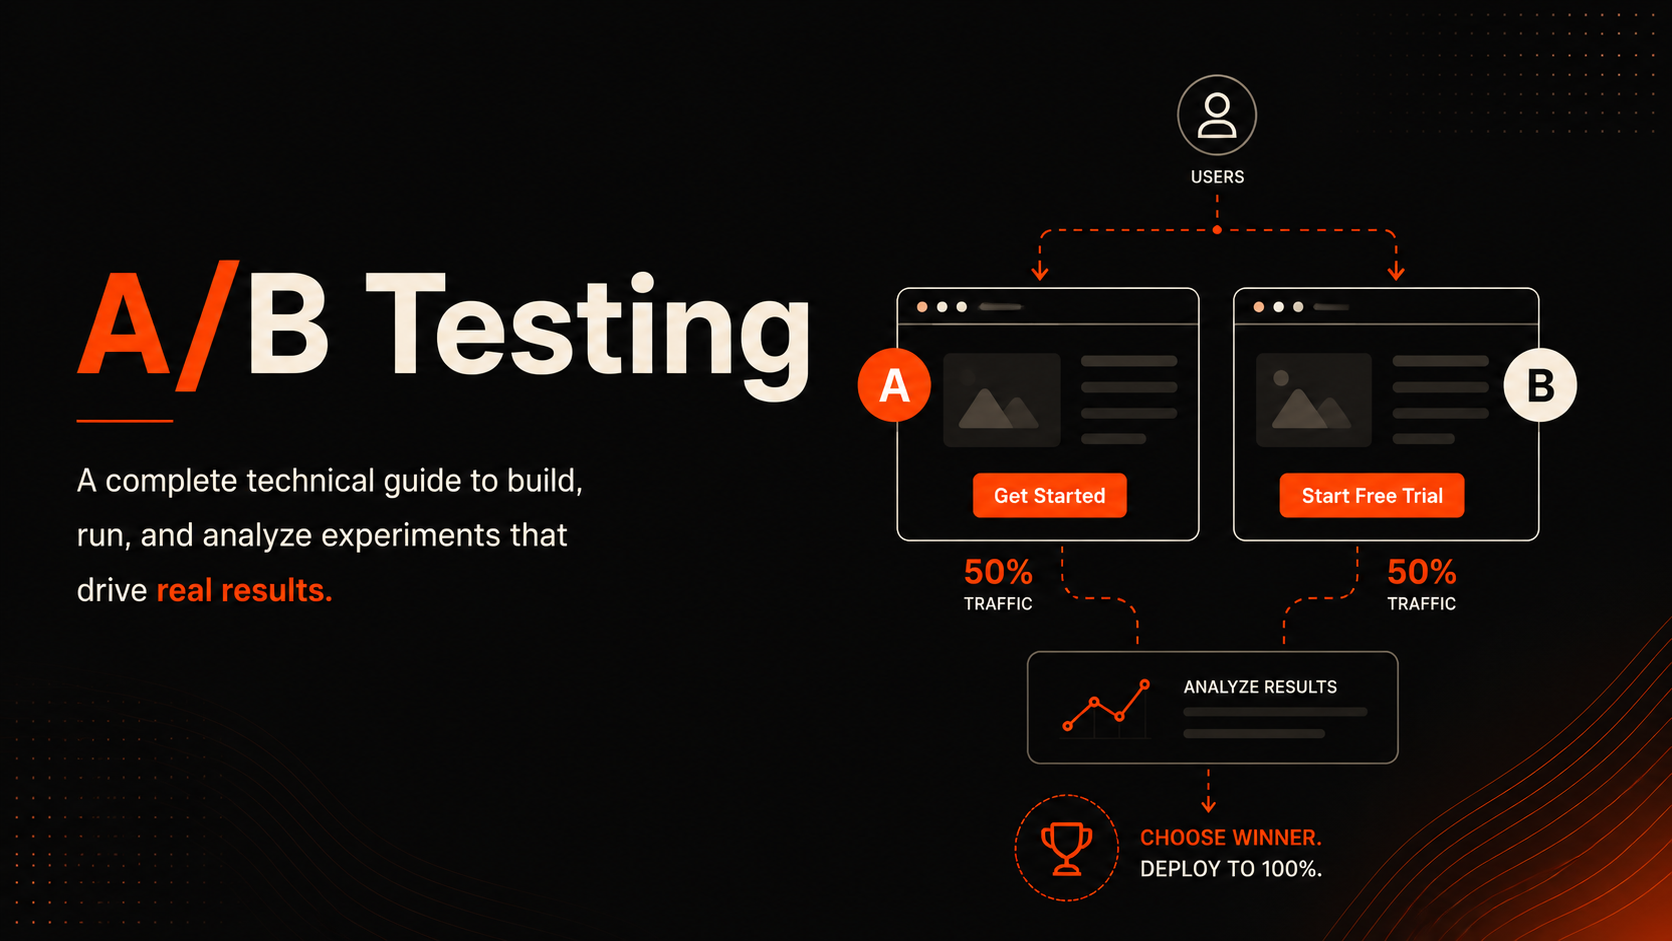
A/B testing (also known as split testing) is an experimentation methodology used to compare two or more versions of a webpage, feature, or user experience to determine which performs better against a predefined goal.
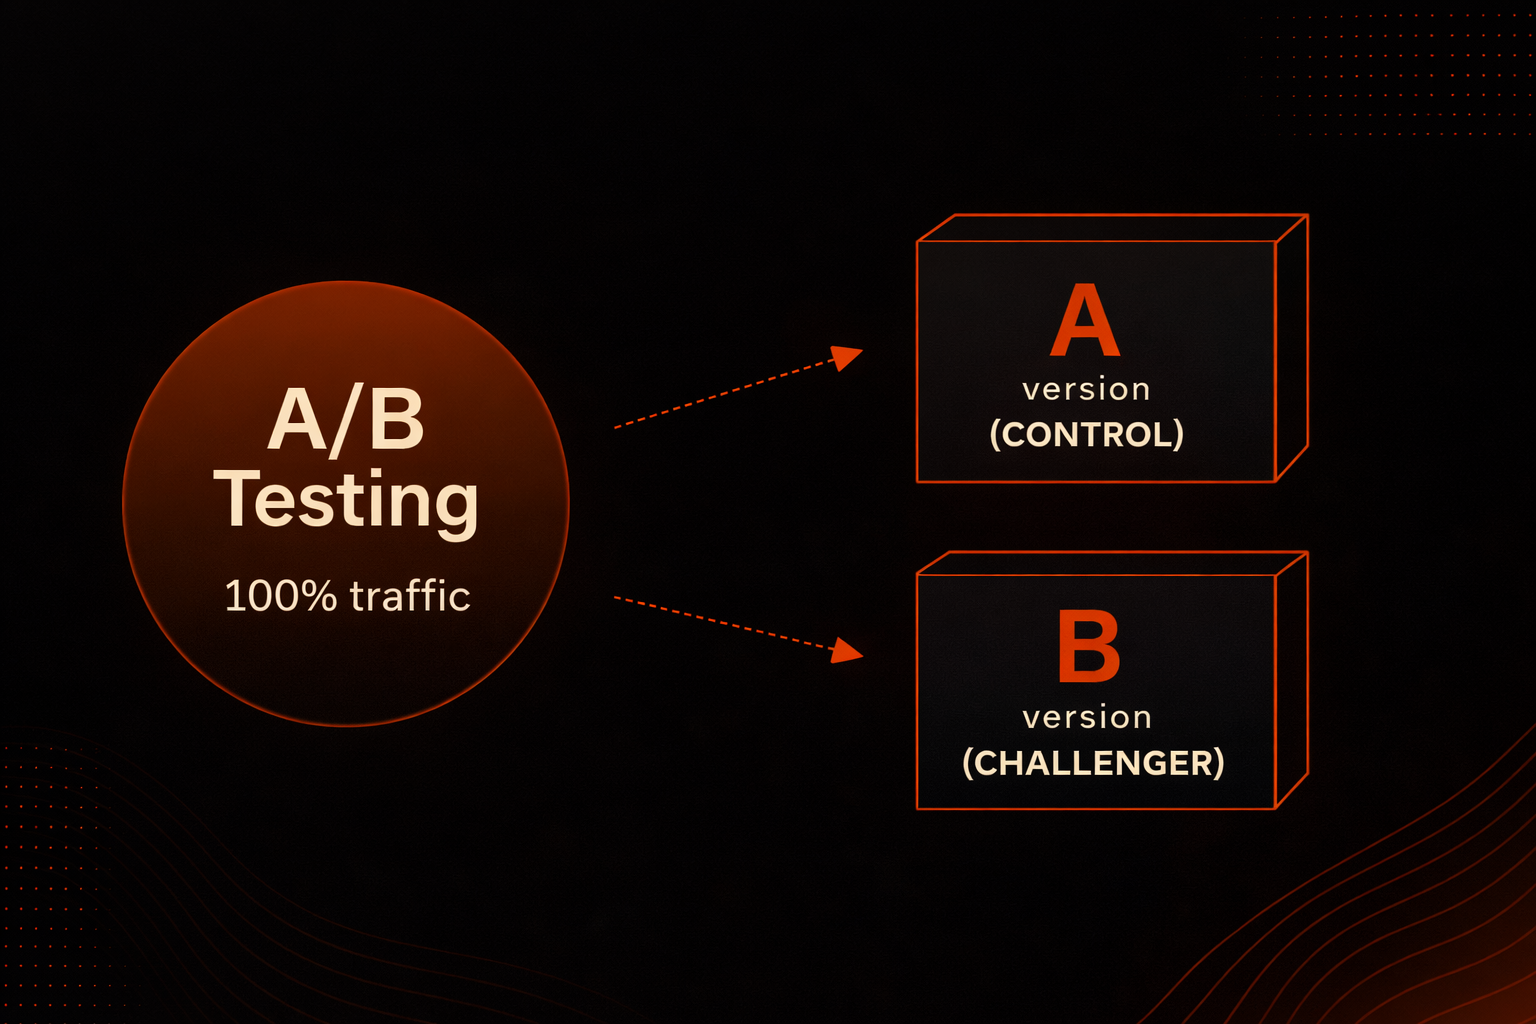
The original version is called the Control (Version A).
The modified version is called the Variation (Version B).
Users are randomly assigned to one of the versions, and their behavior is measured through analytics tools.
The variation that produces better results can then be rolled out to all users.
Simple Example:
Imagine you have an eCommerce product page.
Version A (Control)
- Product title
- Product images
- Product description
- "Buy Now" button
Version B (Variation)
Everything remains the same except the CTA button text changes from:
to
Now traffic is split between the two versions.
If the difference is statistically significant, Version B becomes the winner.
Why A/B Testing Matters?
Many business decisions are driven by assumptions.
Examples:
- "Users prefer larger buttons."
- "Customers want shorter forms."
- "This design looks more modern."
The reality is that user behavior often surprises us.
A/B testing helps organizations move from:
Opinion-Based Decisions → Data-Driven Decisions
Instead of relying on the HiPPO (Highest Paid Person's Opinion), teams can use actual customer behavior to determine what works.
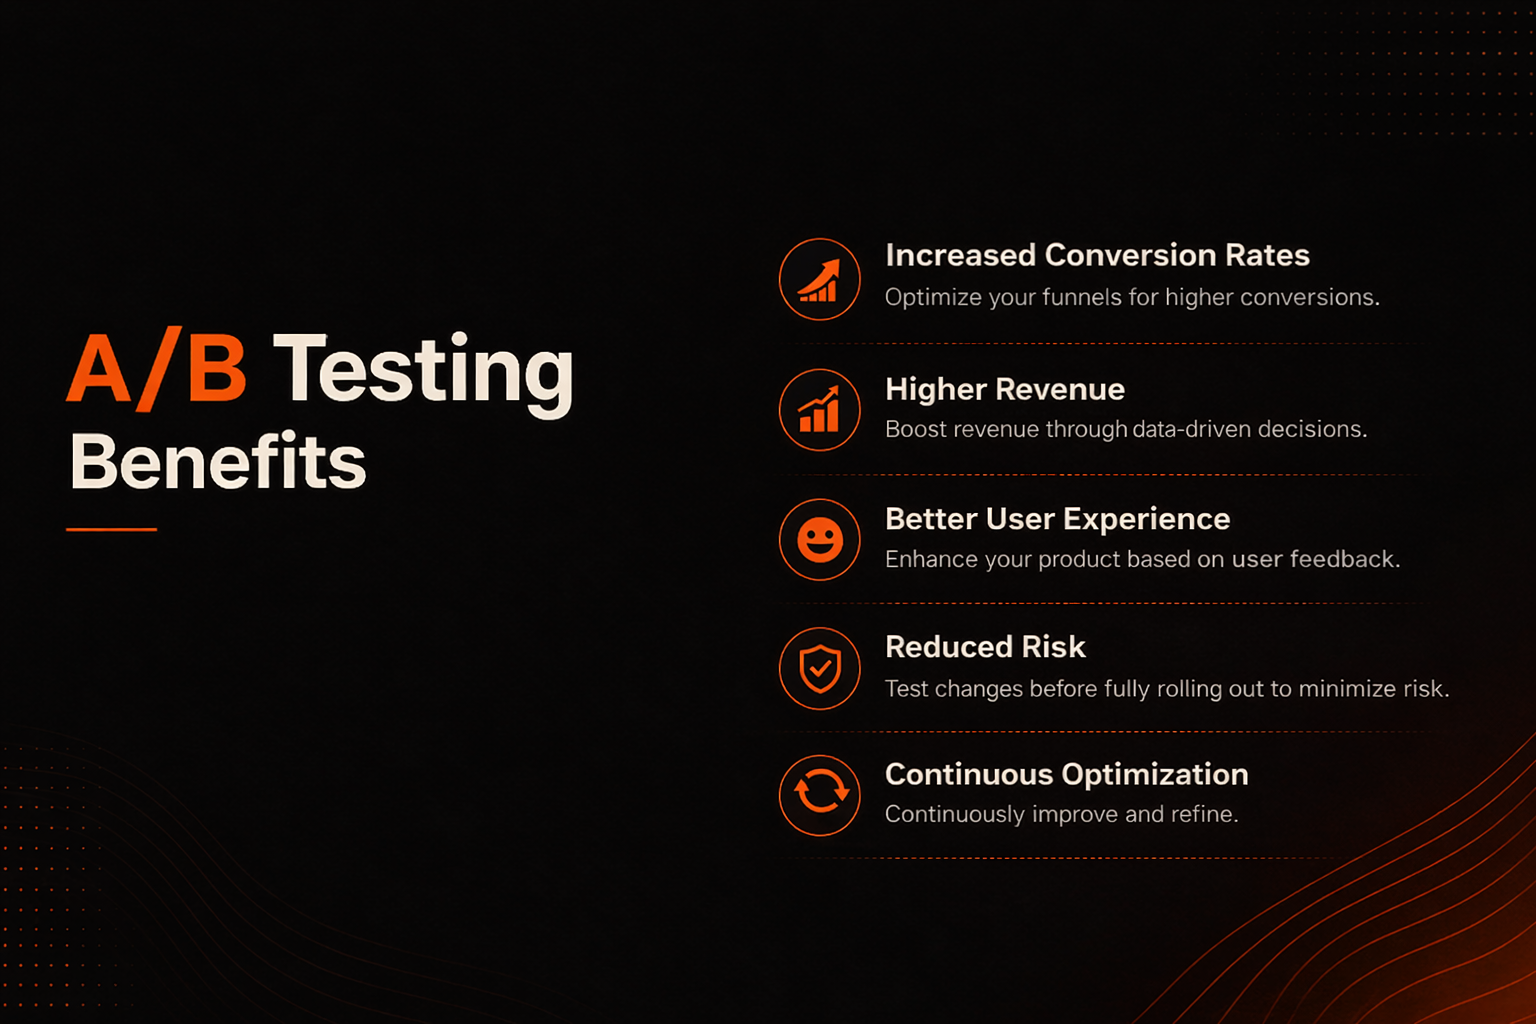
Benefits include:
- Increased conversion rates
- Higher revenue
- Better user experience
- Reduced risk when launching changes
- Continuous optimization
How A/B Testing Works?
The A/B testing process consists of four core components:
1. Traffic Allocation:
Users are randomly assigned to a variation.
Example:
50% → Version A
50% → Version B
For multiple variations:
33.3% → Version A
33.3% → Version B
33.3% → Version C
The allocation can be performed using:
- Cookies
- Local Storage
- Session IDs
- User IDs
- Experiment platforms
2. User Bucketing:
When a visitor first arrives, they are assigned to a variation.
Example:
const variation = Math.random() < 0.5 ? "A" : "B";
The selected variation is then stored:
document.cookie = "experiment=variation-a";
This ensures the user always sees the same version.
Without persistence:
- Page refreshes may change variations
- Results become unreliable
- User experience becomes inconsistent
3. Rendering the Experience:
Depending on the assigned variation, different content is displayed.
Example:
if (variation === "A") {
  renderOriginalHero();
} else {
  renderExperimentHero();
}
This can happen:
Client-side
Using React, Next.js, Vue, etc.
Server-side
Using middleware, edge functions, or backend logic.
CDN/Edge Layer
Using:
- Vercel Edge Middleware
- Cloudflare Workers
- Akamai
- Fastly
4. Event Tracking
Tracking is the most important part of an experiment.
Without proper tracking, the experiment becomes meaningless.
Common tools include:
- Google Analytics 4
- Google Tag Manager
- Mixpanel
- Amplitude
Typical events:
- Page Viewed
- Button Clicked
- Form Started
- Form Submitted
- Purchase Completed
Each event should include experiment metadata:
{
  experiment: "homepage-hero-test",
  variation: "B"
}
This allows performance comparison between variations.
A/B Testing Architecture in Next.js
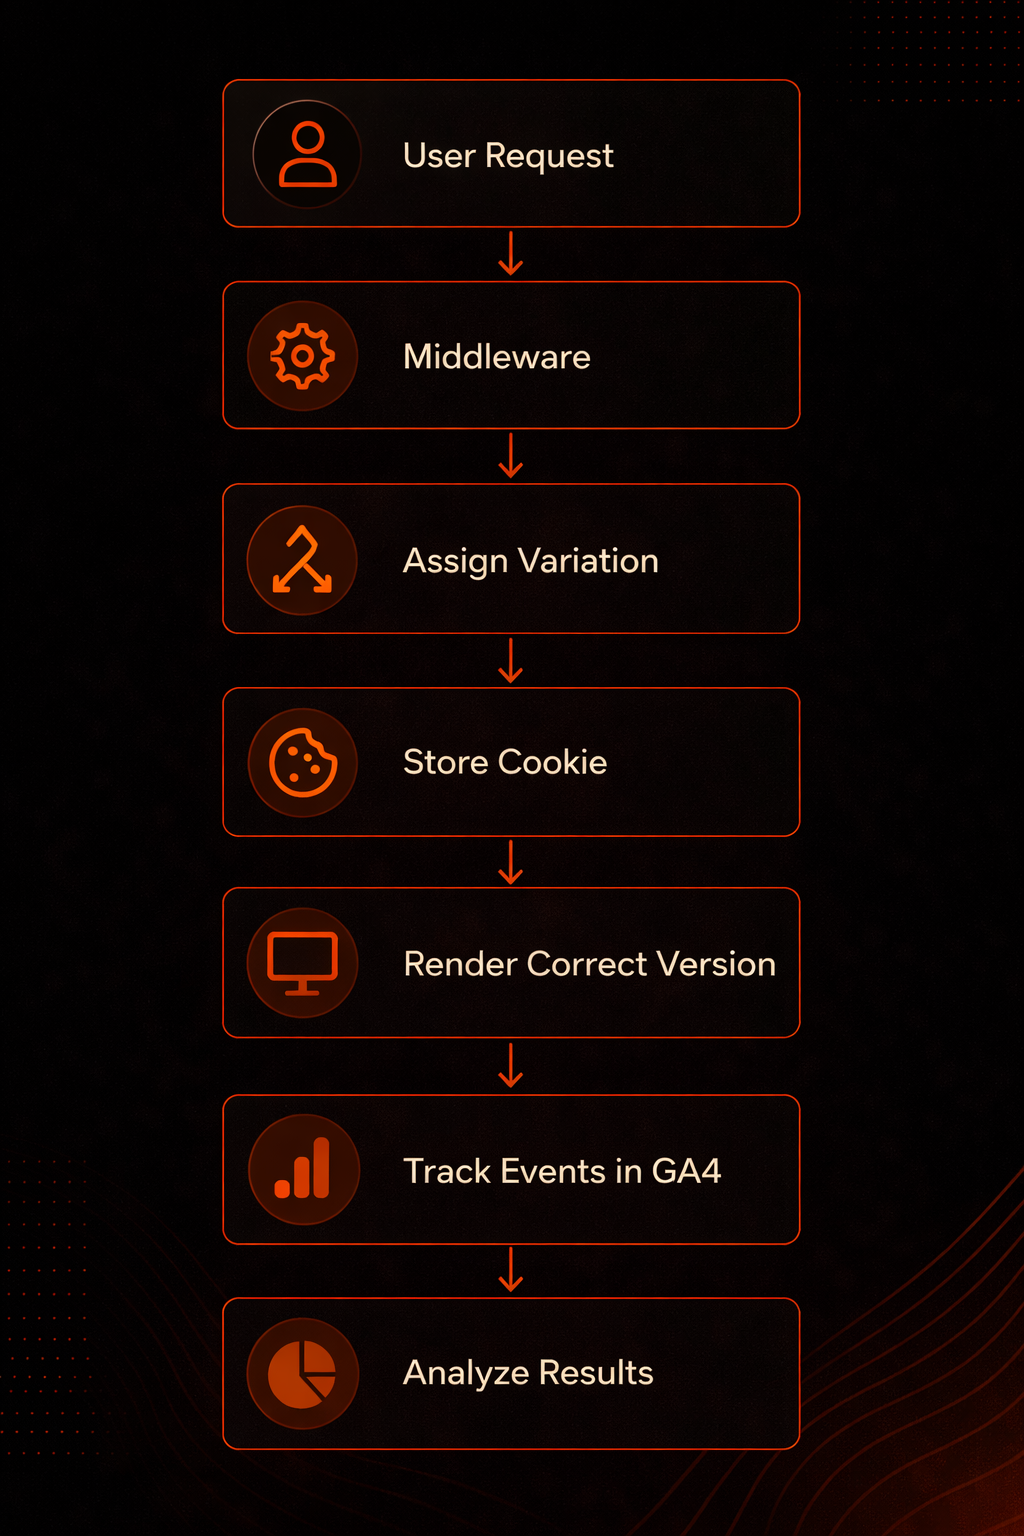
For modern applications built with Next.js, a common architecture looks like this:
if (!cookieExists) {
  assignVariation();
  setCookie();
}
The assigned variation is then available throughout the application.
This approach prevents flickering and improves consistency.
Key Metrics to Measure
The success of an experiment depends on selecting the correct metrics.
Primary Metrics
Directly tied to business goals.
Examples:
- Conversion Rate
- Revenue
- Purchases
- Lead Generation
Secondary Metrics
Supporting indicators.
Examples:
- Click Through Rate (CTR)
- Scroll Depth
- Time on Page
- Bounce Rate
Guardrail Metrics
Metrics that ensure nothing breaks.
Examples:
- Page Load Speed
- Error Rate
- API Failures
- User Retention
Statistical Significance
One of the most misunderstood aspects of A/B testing is statistical significance.
Suppose:
Does B win?
Not necessarily.
The difference may simply be random chance.
Statistical significance helps determine whether the observed difference is likely caused by the change rather than randomness.
Most organizations use:
95% Confidence Level
This means there is only a 5% probability that the observed result happened by chance.
Never declare a winner before reaching sufficient sample size.
Common A/B Testing Mistakes
Testing Too Many Things
Bad:
Changed:
If performance changes, you won't know which change caused it.
Instead:
Test one major variable at a time.
Ending Tests Too Early
A common mistake is checking results every day and stopping once a variation appears to be winning.
This is known as:
Peeking
Wait until:
- Required sample size is reached
- Statistical significance is achieved
Ignoring Seasonality
Running a test during:
- Black Friday
- Christmas
- Product Launches
may produce misleading results.
Always consider external influences.
Poor Tracking Setup
Incorrect analytics implementation can invalidate an entire experiment.
Verify:
- Event firing
- Conversion tracking
- Variation assignment
- Revenue attribution
before launching.
Real-World Experiment Examples
Landing Page Test
Goal: Increase lead generation.
Variation
Book a Demo
to
Schedule Your Free Consultation
Metric
Form submissions.
Pricing Page Test
Goal: Increase subscriptions.
Variation
Highlight annual pricing first.
Metric
Paid conversions.
Checkout Flow Test
Goal
Reduce abandonment.
Variation
Reduce form fields from:
12 Fields
to
6 Fields
Metric
Completed purchases.
Conclusion
A/B testing is one of the most powerful tools for improving digital experiences because it replaces assumptions with evidence. Whether you're optimizing a landing page, improving an eCommerce checkout flow, or testing new product features, experimentation allows you to understand what truly resonates with users.
The most successful teams don't view A/B testing as a one-time activity. Instead, they treat it as a continuous optimization process forming hypotheses, running experiments, learning from results, and iterating based on data.
When implemented correctly with proper traffic allocation, tracking, statistical analysis, and documentation, A/B testing becomes a reliable framework for driving growth, improving user experience, and making confident product decisions.